
It’s been 16 months since the November 6, 2012 general election. North Carolina is one of those states that has public voter registration information, which is ongoing as new voters register and other voters either die or move away. Looking at voter registration trends, one can get a glimpse of some of the small changes happening beneath the surface. Over time, they add up to massive change.
Since 2012, Democrats have lost 108,186 registered voters, while Republicans have lost 54,368. At first, this looks like good news for Republicans, as Democrats are losing voters at almost twice the rate. But remember, a lot of these registered Democrats are likely to be older, conservative Democrats, many of whom support Republican candidates, especially for federal office.
Unaffiliated voters, on the other hand, have gained. There are 22,515 more unaffiliated voters than there were on Election Day 2012. When it comes to unaffiliated voters, the most important thing to determine their ‘actual’ partisan affiliation is to look at where they’re registering. Unaffiliateds in Brunswick County, for instance, are far more likely to support Republican candidates. An unaffiliated voter in Durham County, on the other hand, is very likely to be Democrat-leaning. And of course, African American voters who are unaffiliated lean very heavily to Democrats.
In total, North Carolina has 136,000 fewer registered voters than in 2012. Does this mean the state is losing population? Of course not. After an election, certain inactive voters are taken from the voting rolls. And there are a large number of people who relocate to the state who do not register until the year of the next presidential election. This is especially true for Democratic-leaning voters. Overall, those who register as soon as they relocate are more likely to be Republicans. So, don’t despair: these kind of numbers are normal.
Overall, 90 out of 100 counties suffered a net loss in voters. This is, again, unsurprising. But what about the 10 that gained? This is a strong indication that these counties are, in fact, growing enough to offset the typical loss in registered voters. Take a look at the map below. The counties in green are the ten that have seen a net gain in total registration. The ten counties in red have seen the greatest falloff in registered voters.
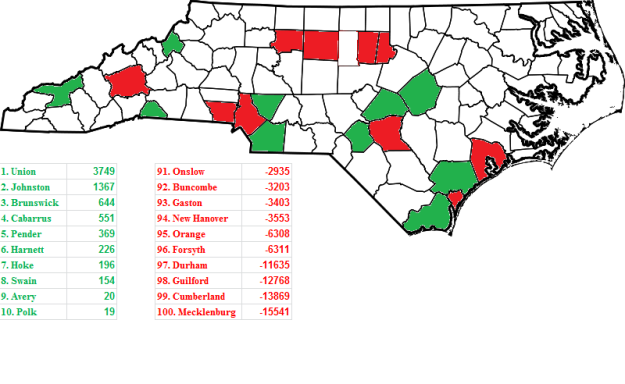
Democrats should note, with dismay, that the ten counties with a net gain in voter registration tend to be strongly Republican suburban areas. In fact, of the ten, only Hoke County supported President Obama in 2012. The ten bottom, on the other hand, tend to be urban Democratic counties, with Obama winning 7 of the 10 in the last election.
What does this mean? Well, it does suggest that the ten counties in green are growing. But the absence of several urban counties on that list shouldn’t worry Democrats. Remember – Democrats wait until election year to register. And just because most of the green counties supported Romney, does not mean that the new voters are Republicans. They could be hardcore liberals for all we know. Notice, also, the absence of Wake on the “biggest losses” list. With Wake having the most voters, we would expect Wake to be at the bottom. The fact that it isn’t strongly suggests that Wake County is still growing, and faster than other urban counties like Mecklenburg and Durham.
Because looking at raw numbers can only tell us so much, we need to look at these changes in percentage terms:

Counties is dark green saw a net percentage growth in registered voters. Counties in light green saw a percentage decline, but did better than the state average. And counties in red saw a greater percentage loss in registered voters than the state average.
Conclusion: Overall gains in registration don’t tell us much at all, though it does serve to indicate which counties are growing. It doesn’t, however, tend to give us an accurate picture of the reverse. Nor can we tell from these numbers alone what the political implications will be going forward. Next post, we’ll look at the partisan numbers and see how they’ve changed, and what they can reveal about the future of NC politics, if anything.
John Wynne is the “conservative voice” at PoliticsNC, where he also provides polling analysis and commentary on legislative campaigns. When not writing about politics, he enjoys gardening and listening to opera. Contact: johncwynne@gmail.com.


0 Comments